
WHAT IS METRX?
METRX is the end-to-end solution for mid- and enterprise-level companies, offering instant insights into engineering efforts. METRX creates personalized dashboards to help you evaluate your engineering outputs, uncover bottlenecks across your organization's workflow, and resolve them.

1.: Oversee Engineering Activities
Receive Instant
Insights
Get instant insights into your engineering efforts! We analyze your processes and teams.

2.: Reveal OPPORTUNITIES
Uncover Bottlenecks
METRX pinpoints bottlenecks and opportunities for greater efficiency and output in an easy-to-read, personalized dashboard.

3.: Resolve
Fix The Found Barriers
Leverage METRX’s objective findings to implement new protocols for performance management or tap into Gigster’s ten years of experience to tackle issues found.
METRX MAKES REACHING YOUR KPIs EASY AND TRACKABLE
METRX’s unique assessment cross-references your organization’s data, and each report is customizable according to your needs. The result is actionable insights to track and achieve your KPIs.
Find and resolve your engineering bottlenecks in 3 steps
Data Extraction
METRX connects to your code by any GIT repository, and to your issue-tracking system like JIRA.


Data Evaluation And Analysis
We analyze the data by pulling the code and all its history – who contributed to it, activity levels for commits, merges, reviews, size, and complexity of the code. From the issue tracker system, we also gather project and ticket based data. We do comparative evaluations against peers within the same team, with the ability to compare teams, projects, and individuals.

Data Evaluation And Analysis
The data is analyzed by pulling the code and all its history – who contributed to it, activity levels for commits, merges, and reviews, size, and complexity of the code. Comparative measures against others on the same team.
Personalized Review
The METRX team reviews all the data with you for a thorough understanding of your team(s) and further refines reporting, instantly resulting in a customized view of your organization.

Solve Challenges: Beyond Analysis, We Drive Solutions
Take Charge of the Next Steps After our Comprehensive Review
#1
Leverage Gigster's Expertise
Save time and resources – deploy a team from Gigster to resolve any issues found, leveraging their ten years of experience and global team of experts.
#2
Take Charge Independently
Address METRX’s findings at your own pace, with your own team
#3
Sustain Ongoing Monitoring
Sustain tracking of your engineering organization using METRX reporting on a weekly, monthly or quarterly basis
Why METRX
- End-to-End Solution
- Instant Engineering Insights
- Data Control
- Informed Decision-Making
- Flexible Risk Management
Straightforward Pricing
yearly

$
40
- Bi-Weekly reports
- Online Dashboard
- 24/7 Customer Support
- All METRX Reports Included
MONTHLY

$
50
- Bi-Weekly reports
- Online Dashboard
- 24/7 Customer Support
- All METRX Reports Included
One time Package
$
4,999
- Initial Reports Generated in One week
- Online Dashboard
- 24/7 Customer Support
- Up to 300 developers included
- All METRX Reports Included
A METRX analysis was conducted within a software organization in the energy sector.
Review this case study to understand the impact an objective analysis had within this organization.
METRX Reports
Every METRX report is tailored to showcase the specific information you need to understand about your organization.
Curious to learn more? Review these examples below:
Weekly Code Contribution Per Team
- Gain insight into the extent to which teams contribute through the deployment of new code and code modifications.
- This aids in identifying teams facing obstacles in their code contribution efforts.
" Thanks to METRX we learned that one of our team had a declining trend in their productivity. Once we clearly saw it the team leader could jump in and started to remove obstacles. "


Weekly Code Contribution Per Developer
- Understand team members’ contribution over time.
" Thanks to METRX we are able to measure how new developers are catching up. I helped us to optimize our onboarding and new hires started to be more productive sooner. "
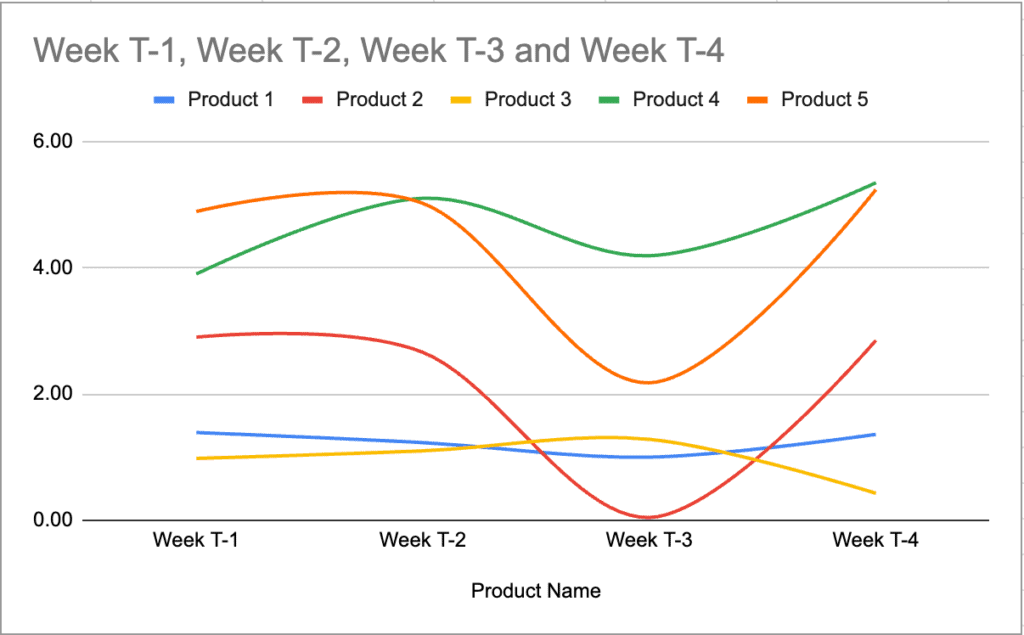
Code Contribution By Product Per Week
- Shows if the developers are working on the right products.
- Identifies how much efforts they put into each product.
- Helps to understand how development speed changes per project over time.
- Works without time-tracking.
" We realized most of our engineering output was allocated to experimental projects and the real revenue-generating project was understaffed. "

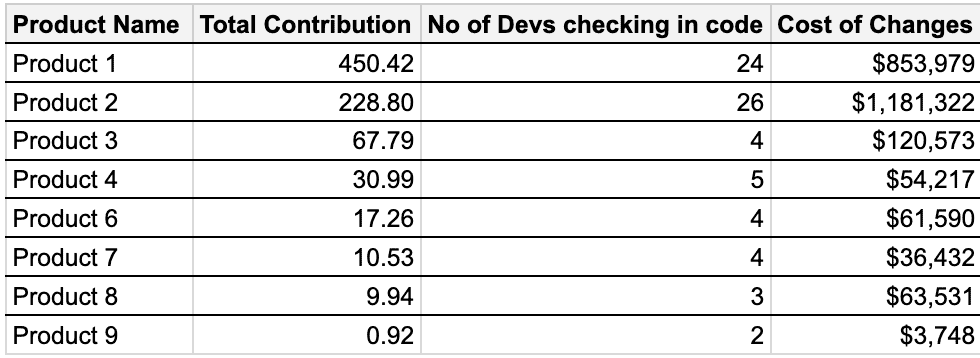
Cost Per Product
- We can offer a highly accurate estimate of the engineering expenses for product development even without the use of time logging.
- Can be done by commit/ticket/epic/project.
" We got valuable feedback immediately how engineering dollars are spent between projects and what are the most expensive developers. We analysed those and understand how to avoid expensive mistakes. "
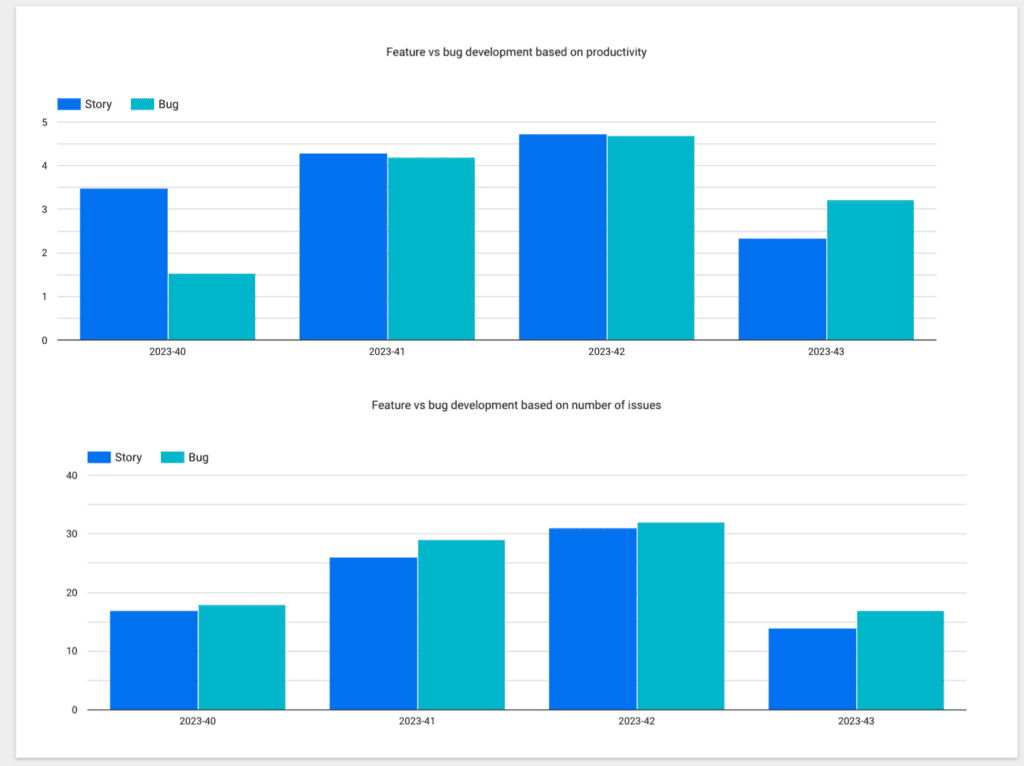
Feature Development Vs Maintenance Ratio
- In an ideal scenario, bug fixing should account for less than 30% of the total workload.
- Even without time tracking, we can assess the extent of engineering resources dedicated to maintenance, which offers a more precise measurement than merely tallying ticket numbers in JIRA.
" The biggest take away was developers could work only on the roadmap up to 50% of their capacity. We had to better distribute work between developers so they can focus more on important developments. "
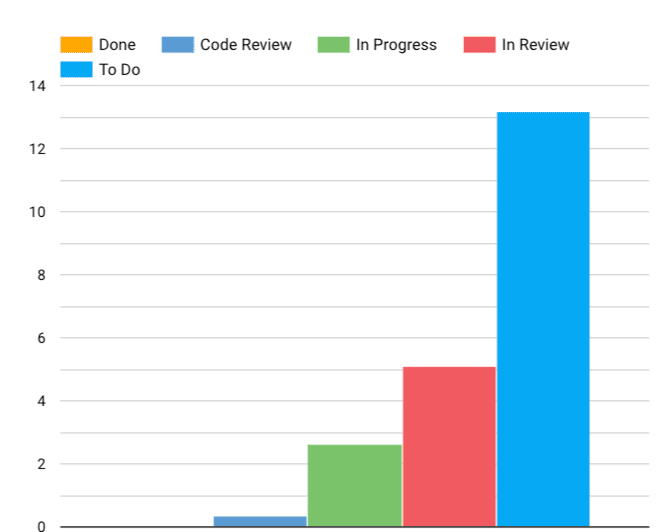
Cycle Time
- Ideally you want your cycle time to be short.
- It enables your team to reach fast, get a short feedback loop and iterate fast.
- Longer cycle time means there are bottlenecks in the SDLC (Software Development Life Cycle).
" Following the right metrix the team is now motivated to work on smaller tickets. That helped us to deliver faster smaller chunks of improvements and reduce the number of big risky deployments. "
Issue Status Flow Chart
- Every SDLC has an ideal flow from the start status to the desired end status. However in some cases the issue has to go back into a previous status because of quality issues (failed code review, failed QA, etc.).
- This reports shows how many times the tickets are failing or passing.
- This chart can be generated per project, developer for a selected time interval.
" First, we were happy our code review acceptance rate is 96%. After that it turned out our code review process has serious flaws. Even bad codes passed passed too many times. "
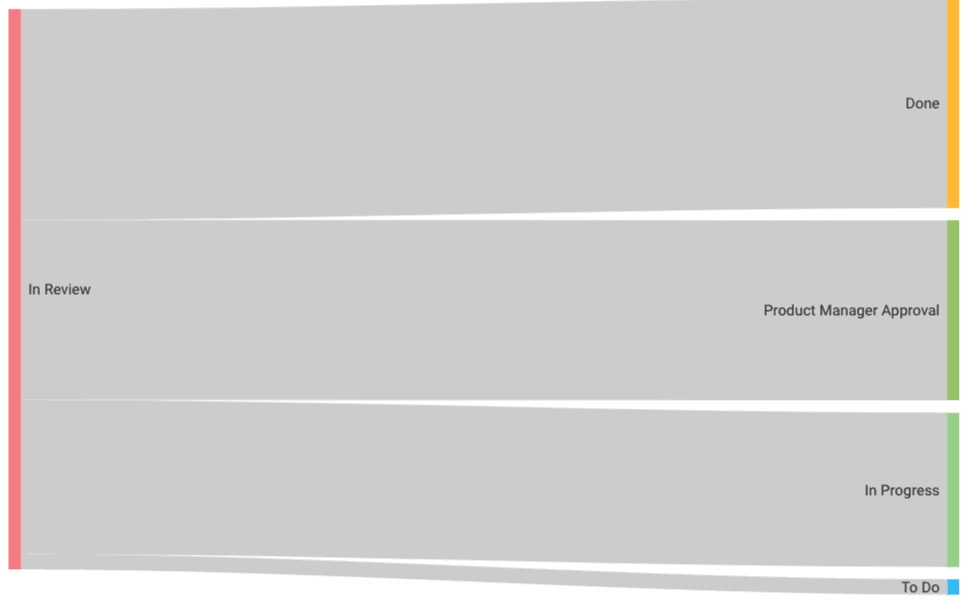
We tailor every METRX report to showcase the specific information you seek about your organization.
FAQ
Data Security and Implementation
We provide details on the tool’s data security measures and clarify the integration process, including the expected timeline. We secure data during transmission and while at rest.
Customization and Scalability
We employ a standardized enterprise visualization solution utilizing Google’s Data Management and Visualization tool, such
as Google Looker Studio. The data is transferable to alternative platforms, such as Microsoft’s PowerBI, allowing seamless integration and direct data provision if you are already using a dashboard solution.
User Training and Support
We provide personalized on-boarding sessions, comprehensive documentation, and responsive ongoing support to ensure a smooth and successful implementation of METRX.
Breakdown of the Cost Structure
We collect an upfront payment as a one-time fee, and you have the option to pay through wire transfer or ACH. We bill monthly for ongoing subscription fees with the convenient option of automatic payments through a credit card.
What Metrx Measures
METRX measures the following aspects of the code contributions: code volume, frequency, technology, rank, and consistency.
Which Teams Can Benefit from METRX
METRX can be exclusively used for engineering teams/organizations to assess software developers’ performance, not other teams’, like finance, HR, CS, etc. It evaluates software developers’ performance by examining their code contributions/commits within a defined period.
Companies Already Leveraging METRX with Confidence


